The Pencil Code
a modular MPI code for differential equations and particles: multipurpose and multiuser-maintained
How to do benchmarks and timings
pencil-code/samples/helical-MHDturb
Most of the timings reported in the manual of the Pencil Code (currently page 68) are based on the run checked in under pencil-code/samples/helical-MHDturb.
To run MPI, you want to edit src/Makefile.local and change MPICOMM=nompicomm into MPICOMM=mpicomm. You also want to edit the file src/cparam.local and change ncpus=1,nprocy=1 for example to ncpus=256,nprocy=4, which means that you will be using 256 procs in total and 4 in the y direction (so 64 in the z direction). Note that the layout may be very important (see the manual).
Of course, on a bigger computer you also want to run a bigger mesh, so change nxgrid=32 for example to nxgrid=512, which means 5123 meshpoints.
To run for more time steps, just change in the run.in file the entries nt=10, it1=2 for example to nt=300, it1=10, which means you are running 300 time steps and output on the console come every 10 time steps. (If ialive=1 is set, you can check the progress of the code conveniently by monitoring the content of the file data/proc0/alive.info, which contains the time step number on processor 0 (or any other processor if you look under another data/proc? directory.)
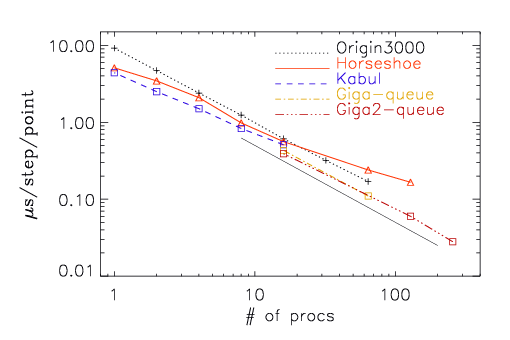
The timings that are reported in the manual and shown in the figure below (for an Origin 3000 and a Linux cluster with clock frequencies between 2.0 and 3.2 GHz) are obtained by looking at the output at the end, where it says for example Wall clock time/timestep/meshpoint [microsec] = 5.4, which means it ran 5.4 microseconds per meshpoint and per time step. (Make sure the code doesn't produce NaNs, of course...)